Create a Combined Report Layout
Snap allows you to create a single combined report, incorporating features of different report layout types. There is no limits on how many reports you can combine.
In this tutorial, we will create a combined report that uses the features of mail-merge and chart-based reports.
The tutorial consists of the following sections.
Add Mail-Merge Report Functionality
In this section, we will create a simple Mail-Merge Report.
- Create a new Snap document and provide it with a master-detail data connection.
-
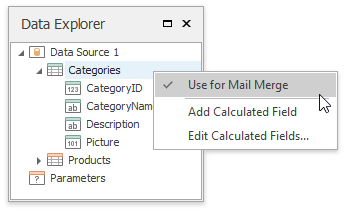
Specify which data source will be used for mail merge by right-clicking the required data source in the Data Explorer and select Use For Mail Merge in the invoked drop-down menu.
-
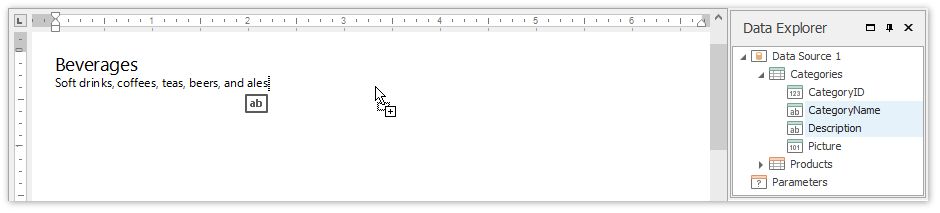
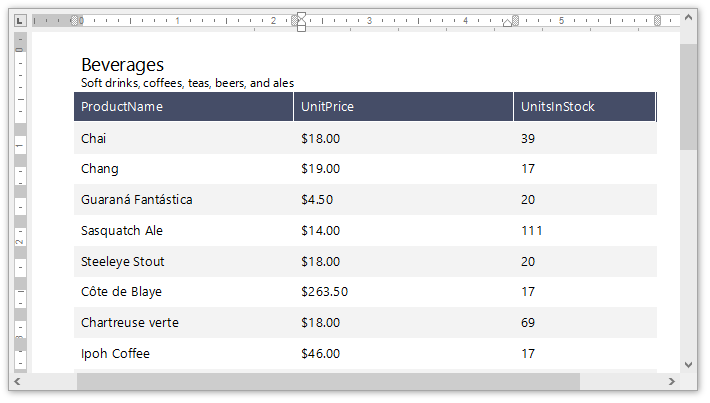
Insert a master report part. To do this, drag-and-drop data fields from the Data Explorer onto the Design Surface.
-
To insert a detail report part, drag-and-drop fields from a subordinate node of the data source.
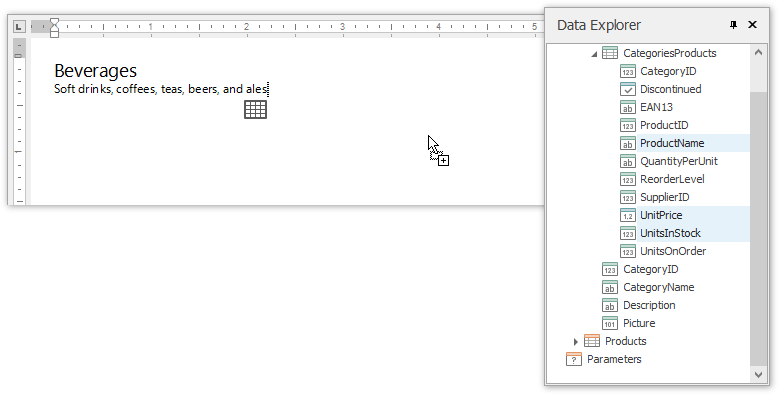
The added detail part will have a tabular form by default.
For more information on the creation mail-merge report, see the tutorial Create a Mail-Merge Report.
Add Chart-Based Report Functionality
In this section we will add a Chart to the Snap document.
-
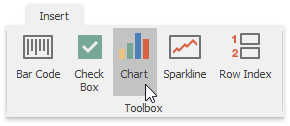
Click the Chart command in the Insert tab of the main toolbar.
-
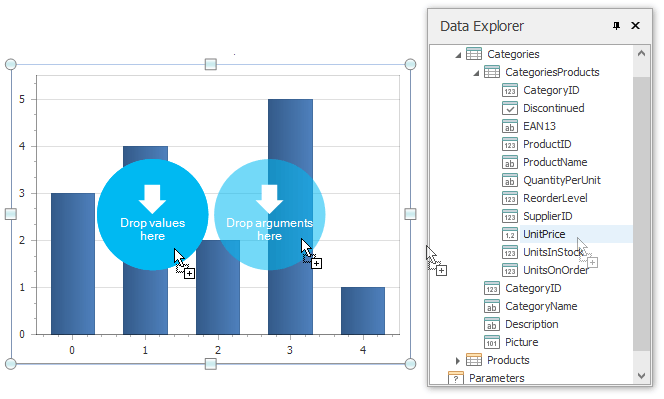
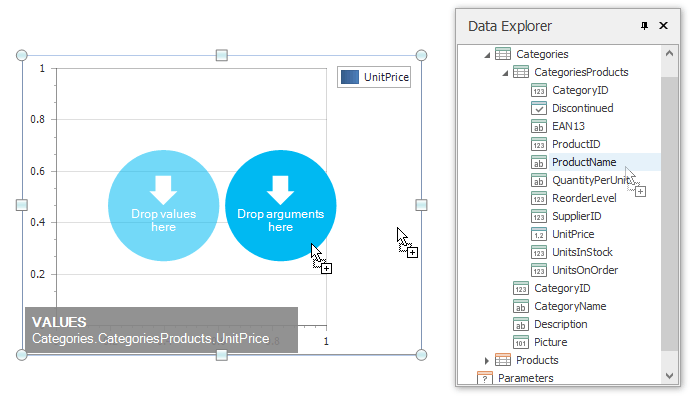
In the created chart, the blue circles correspond to the values and arguments of the chart. Drop one field from a subordinate node of the data source onto the “values” region in the chart…
…and the other onto the “arguments” region.
For more information on the creation of a chart-based report, see the tutorial Create a Chart-Based Report.
View the Result
-
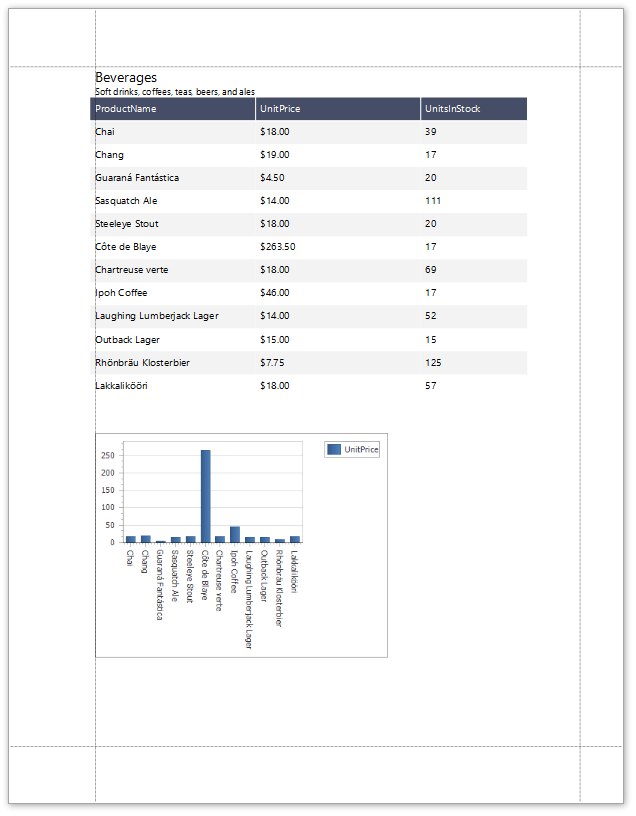
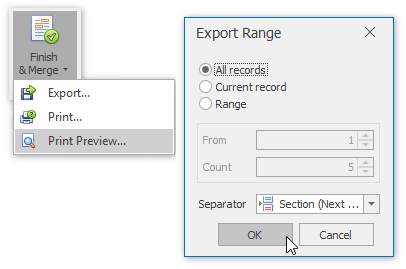
The Snap mail merge document is now ready. To view the result, click the Finish & Merge button in the Mail Merge tab, and select Print Preview… in the invoked drop-down menu. In the invoked Export Range dialog, select All records and click OK.
The following image illustrates a print preview for the final document.