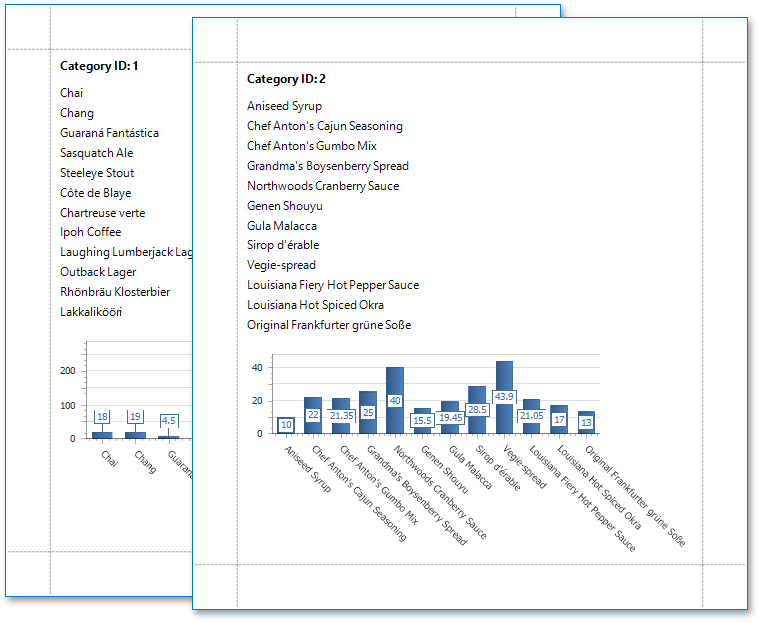
Use Charts to Visualize Data in Report Groups
This tutorial describes how to use charts to visualize data in each report group.
Group Report Data
Do the following to group data in a report:
-
Bind the report to the required database table (for instance, Products).
-
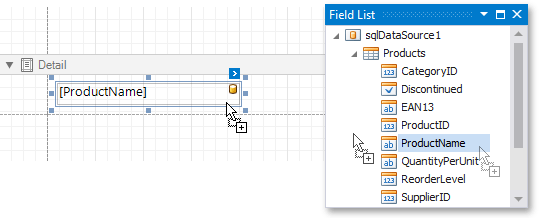
Drop the ProductName field from the Field List onto the report’s Detail band.
-
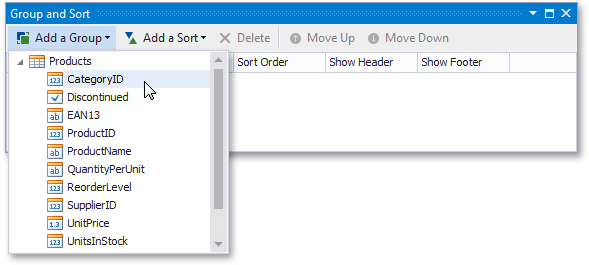
In the Group and Sort panel, click Add a Group and select group criteria (for example, the CategoryID field).
-
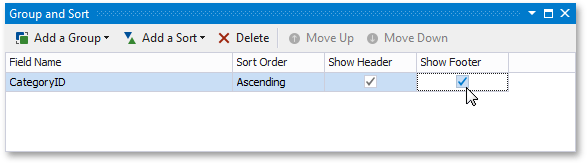
Enable the Show Footer check box to add a Group Footer to the report.
-
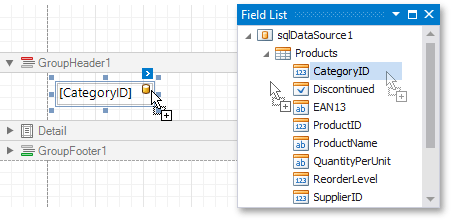
Drop the Category ID field onto the Group Header to display group titles in the report.
Create a Chart
Do the following to add a chart to the report:
-
Drop the Chart control from the Toolbox onto the Group Footer.
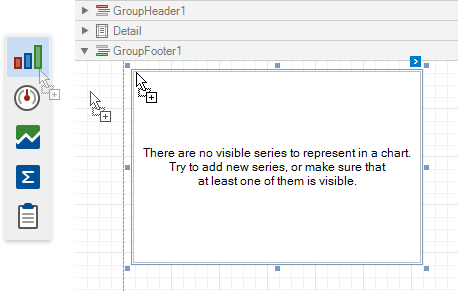
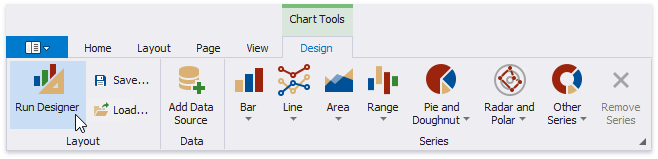
The Chart Designer is invoked. If it is not, open the Toolbar’s Chart Tools contextual tab and click the Run Designer button.
-
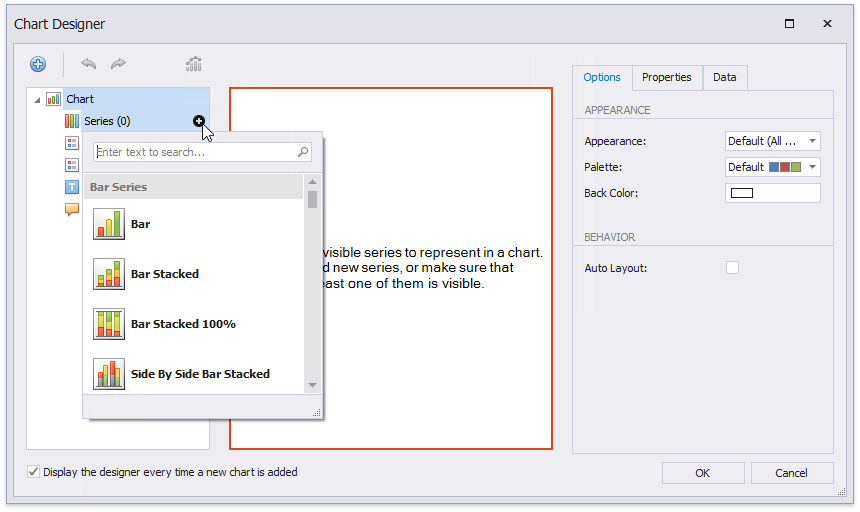
In the Chart Designer, click the plus button to add a new series and select a series view (for example, Bar).
-
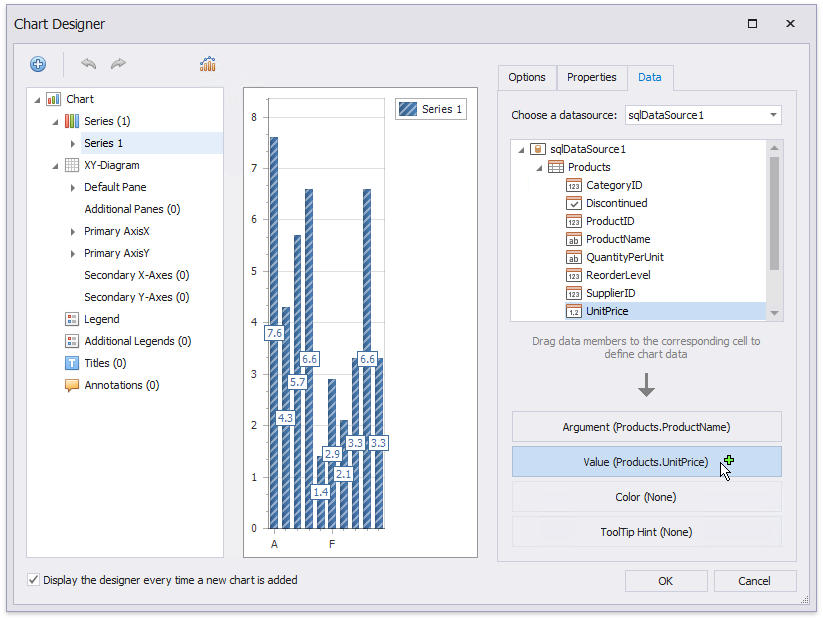
Select the created series and switch to the Data tab.
On this tab, drop the Product Name field onto the Argument area and the Unit Price field onto the Value area.
-
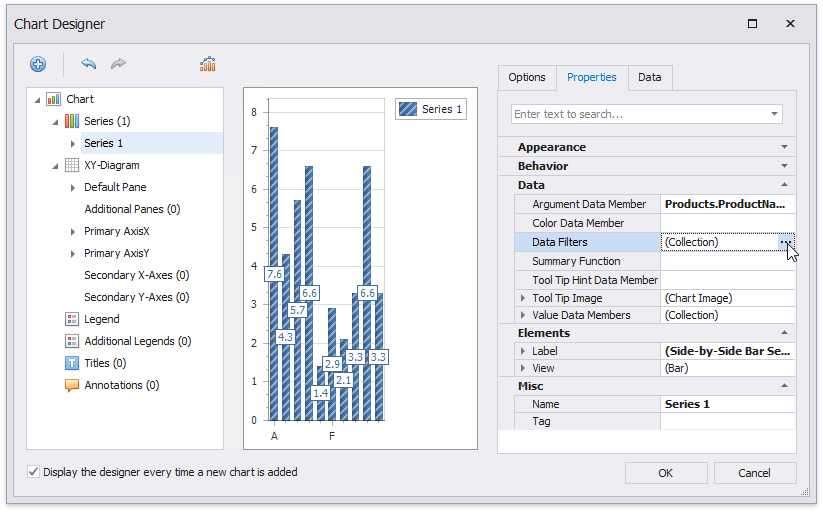
Switch to the Properties tab and click the Data Filters property’s ellipsis button.
-
In the Data Filter Collection Editor, click Add to create a new filter.
Set the filter’s Column Name and Value Binding properties to the CategoryID field that is used as group criteria in the report.
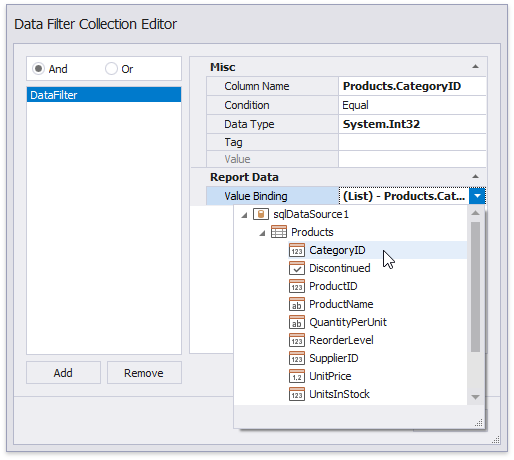
Only the Value Binding setting is taken into account when the Value and Value Binding properties are specified for a data filter.
Switch to Print Preview to see the resulting report.