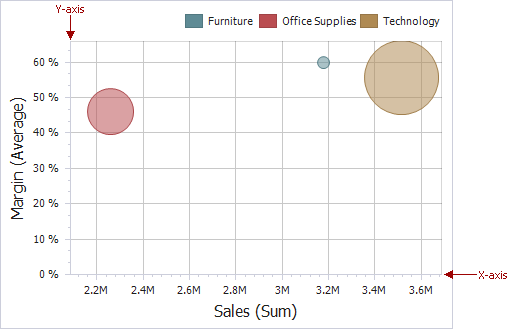
Axes
Scatter Chart X and Y-axes are numerical axis of values. You can specify various axes settings to change visual data presentation.
To access X and Y-axis settings, use the X-Axis Settings/Y-Axis Settings buttons in the Diagram section of the Design Ribbon tab.
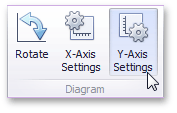
This will invoke the X-Axis Settings/Y-Axis Settings dialog.
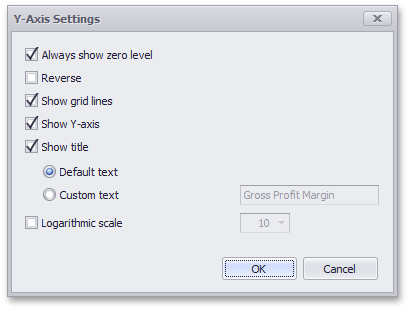
In this dialog, you can specify the following settings.
-
Always show zero level - Specifies whether or not the axis’ zero level is visible. If this option is unchecked, the visible axis range is defined based on the values plotted in the chart.
[!NOTE] Note that the X-Axis Settings dialog does not contain this option.
- Reverse - Allows you to reverse the axis. If the axis is reversed, its values are ordered from top to down.
- Show grid lines - Allows you to hide and show grid lines for the axis.
- Show axis - Allows you to hide and show the axis.
- Show title - Allows you to hide and show the axis title. You can choose whether to use the default text or specify a custom string.
- Logarithmic scale - Specifies whether or not the axis should display its numerical values using a logarithmic scale. The combo box next to this option allows you to select the logarithmic base from one of the predefined values.